
Miami Micro Data, Inc. has Project Management Tools that will change the outcome of your projects

Schedule Comparison

The Comparison Module is where Zümmer really shines because actual progress can be measured against forecasted progress. Actual costs can be measured against forecasted costs and changes to the original schedule can be tracked.
84 Total Comparison Reports & Graphs
53 Activity Reports
15 Cost Reports
14 Changed Logic Reports
1 Comparison Graph
1 Summary Report
Follow the steps above to select your control project and then the project you want to compare against. You can compare any two projects against each other. See how you are progressing against the original plan or compare increases from month to month.
Strategic changes can be initiated once the size of a problem can be identified.
Look at some of the reports on this page to get an idea of the kinds of information that can be generated here.

Changing the major project settings can change the whole nature of the project. If you are evaluating projects in a program this is a must item to check for each submittal update.
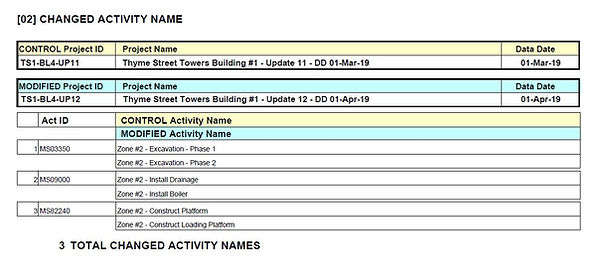
Changing activity names without adding new activity IDs can cause confusion with different project participants.

Adding activities can increase the duration of the project. Everyone must know what has changed

Adding driving path activities will increase the duration of the project. Everyone must know how the changes will affect their portion of the project.
Changes to an updated schedule can create numerous problems but the biggest problem is that the program manager does not have control when this happens. Knowing where the problem started is essential to keeping everything on schedule.

Calendars determine when work can take place so changing them mid project can create problems, but the program manager needs to know so they can understand how the calendar change will affect the schedule.

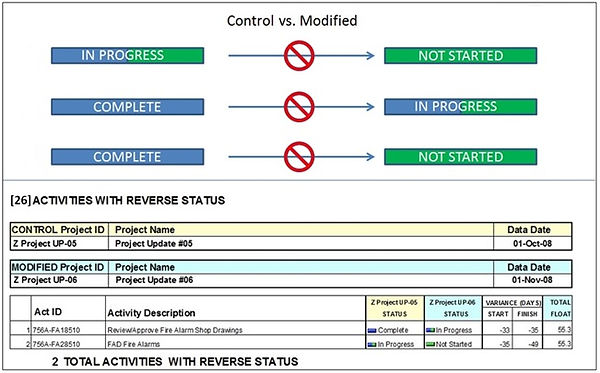
As the project progresses the program manager needs to know if any started activities have had no work on them.
The reasons for no progress within a time period are endless but the program manager needs to be able to assess the impact on downstream and dependent activities.

Added logic changes when things can happen and in some cases will extend the finish date of the project.

Being able to see the effects of changes to the budget are essential to managing a project. In this example the changes did not change the budget, but it could have.

Total float is the amount of time an activity can slip without affecting the end date of the project.
Free float is the amount of time an activity can slip without affecting the start date of its successor.
knowing when float is being used can help the program manager make plans to avoid problems.

Logic changes will affect the schedule, so knowing where and when they happen are essential for understanding the effect they will have on the schedule.

This graph shows the relationship between the original project forecast and the actual progress.
Continuous tracking between the forecast and the actual progress is an important tool for communicating with all the project managers and the owner.